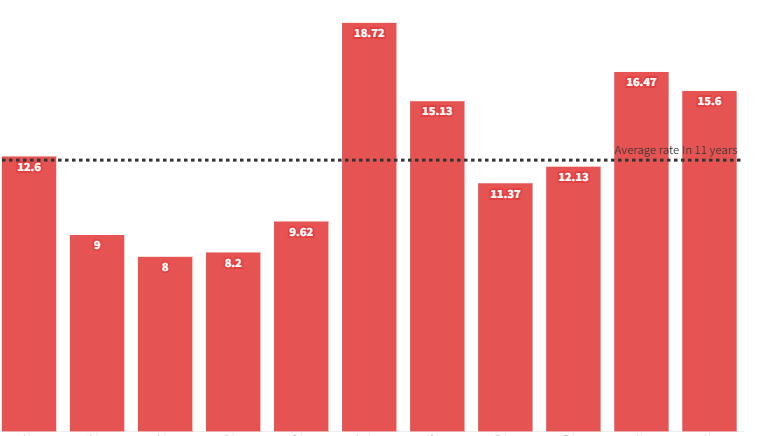
An analysis by Twentyten Daily has shown that at the beginning of every year, between 2012 and 2022, Nigeria’s Inflation rate crossed an average of 12.43 percent five times.
According to data collected from the National Bureau of Statistics report on Consumer Perception Index, that measures the monthly rate of inflation, in January for the period in view, the country rose beyond the average index in 2012, 2017, 2018, 2021 and 2022.
The average index was obtained by dividing the total inflation rate in January by the total number of years in view (11 years). In 2012, the country raised an inflation rate of 12.6 percent.
In 2017, 2018 and 2021, the inflation rate was 18.72 percent, 15.13 percent and 16.47 percent respectively.
In the recently published report by the bureau, Nigeria recorded an inflation rate of 15.60 percent year-on-year in January 2022. This is 0.87 percent points lower than the rate recorded in the corresponding month in 2021 (16.47) percent and 0.03 percent recorded in December 2021.
On a month-on-month basis, the Headline index increased to 1.47 percent in January 2022, this is 0.34 percent points lower than 1.82 percent recorded in December 2021.
The percentage change in the average composite CPI for the twelve-month period ending January 2022 over the average of the CPI for the previous twelve-month period was 16.87 percent, showing 0.08 percent point from 16.95 percent recorded in December 2021.
Highlight of the data
- Nigeria recorded the highest inflation rate in 2017, within the period under review.
- 2017 January inflation rate (18.72%) was also the highest record between 2009 and 2022.
- Nigeria recorded a single digit rate four times within the 11 years; from 2013 to 2016.
- 2014 was the lowest rate the country kickstarted the year on the inflation index.
- Within the 12 months of 2014, the highest inflation rate recorded was 8.5 percent.

